Run the OWASP API Top 10 on every request you capture
Traceptor’s Security Scanner runs OWASP API Top 10 (2023) and Mobile Top 10 (2024) checks against every captured request — passively, no replay. Each finding gets a severity, an OWASP reference, and a score that grades the endpoint A through F.
The standard advice for “test your API for the OWASP Top 10” is some flavor of fire up Burp, point it at the endpoint, and start probing.That works when you have explicit authorization to actively test, you control the target, and you can afford the WAF noise. It does not work when the traffic in front of you is a third-party SDK, a production session you’re trying to debug, or a flow you cannot risk replaying for compliance reasons. Traceptor’s Security Scanner is the answer for that other ninety percent: a fully passiveanalyzer that runs against every request you’ve already captured.
What the Security Scanner actually is
It is a stateless analysis function that walks each request and response, applies a battery of checks drawn from OWASP API Security Top 10 (2023), OWASP Mobile Top 10 (2024), standard security headers, CORS rules, cookie flags, and configuration hygiene, and produces a list of findings. It never replays a request or contacts the server again. Everything is derived from bytes already on disk.
It lives in two places inside Traceptor:
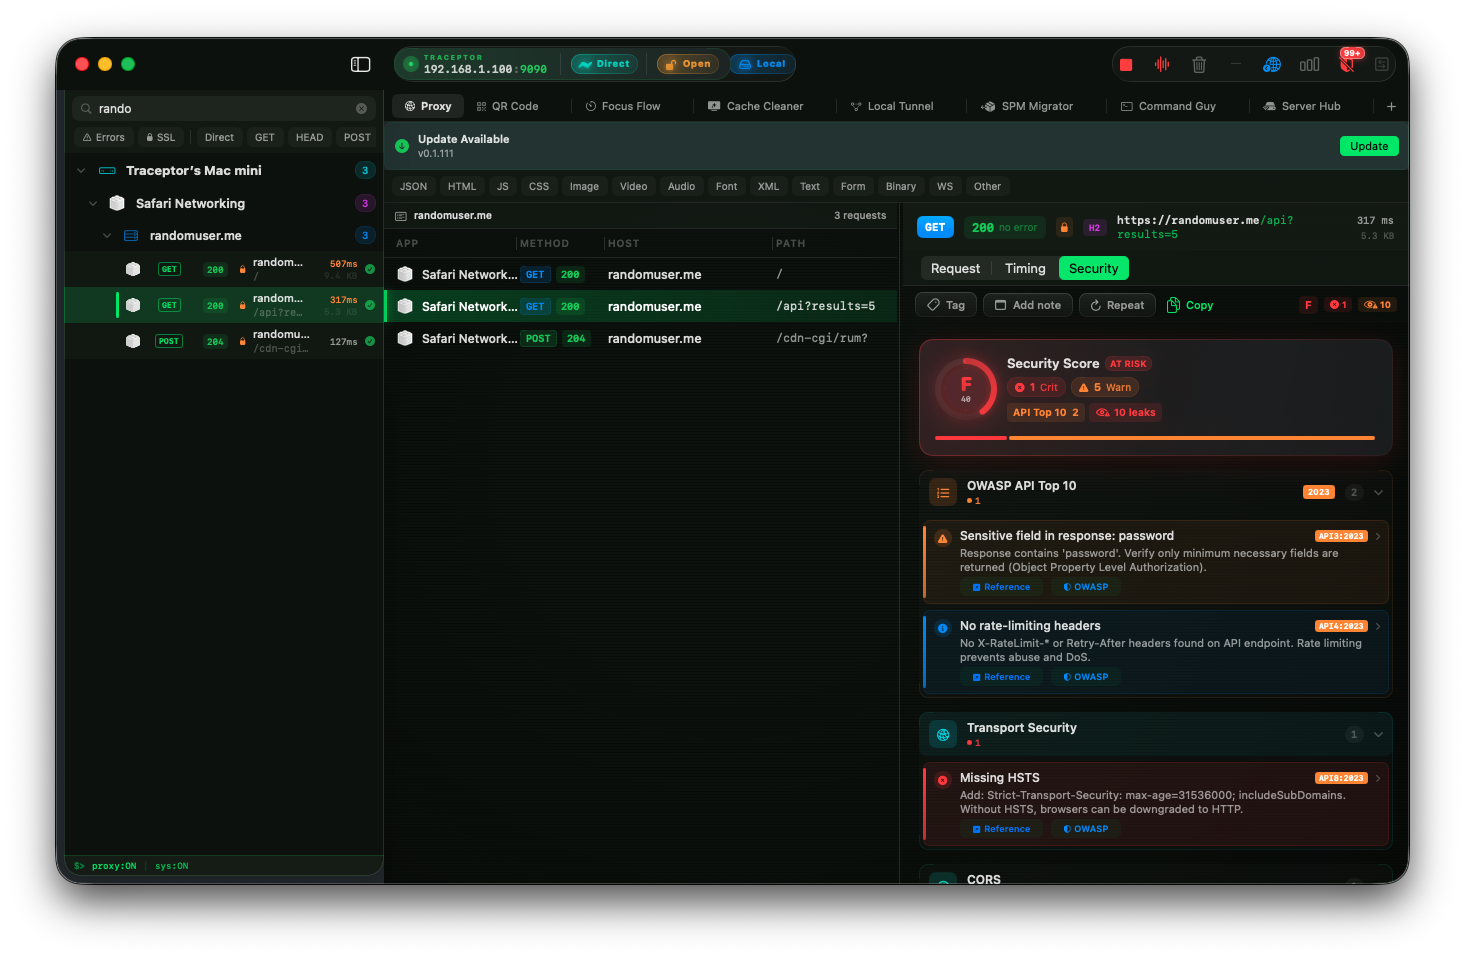
- Per-request, in the proxy list— click any row in the captured traffic, and the detail panel opens with three sub-tabs along the top of the request half:
Request,Timing, andSecurity. The Security sub-tab runs the scanner against that one request and shows a score, a grade, and a grouped list of findings. It re-runs automatically when you click a different row. - Workspace-level scan tab— the API Security Scan view walks every request in
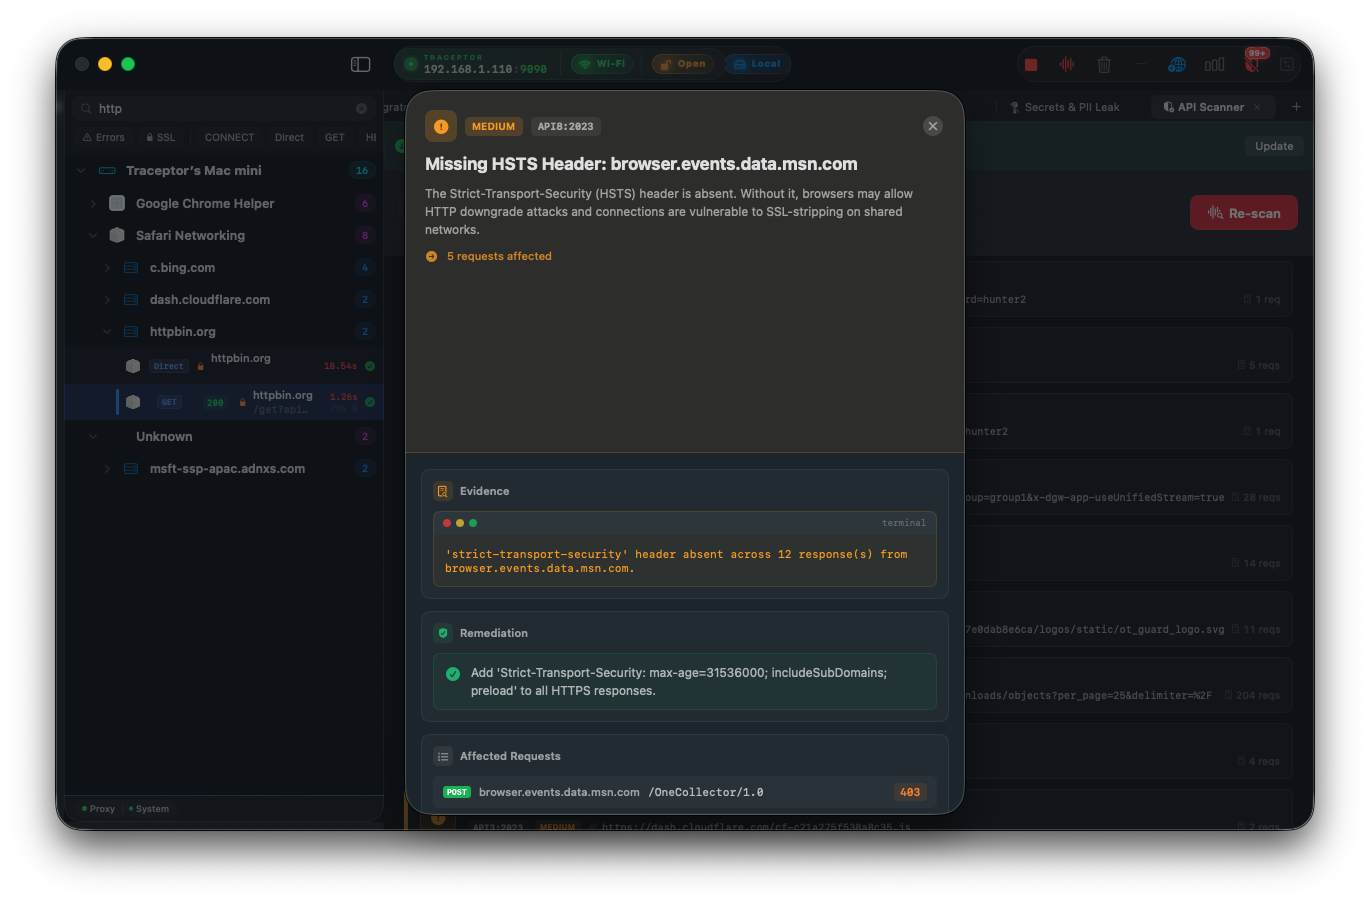
TrafficStoreat once and aggregates findings across the whole session, deep-linking each one back to the originating request.
How findings are scored
Every request gets a numeric score and a letter grade so you can triage at a glance. The formula is dead simple, which is the point.
rulescore   = 100
        − (criticals × 20)
        − (warnings  × 8)
        + (passes    × 2, capped at +10)

grade   = A  if 90–100
        | B  if 80–89
        | C  if 70–79
        | D  if 60–69
        | F  if  <60
Critical findings cost twenty points each because they map to things an attacker can use today — HTTP Basic over plaintext, wildcard CORS with credentials, a missing HSTS on an HTTPS endpoint. Warnings cost eight, info-level findings cost nothing, and explicit passfindings give a small bonus so secure endpoints feel rewarded instead of merely “not punished.” Use the letter grade as a worklist: every F endpoint is a ticket; every D is a backlog item; A and Bendpoints earn the right to a different problem.
What the scanner actually checks
Each finding is tagged with one of these categories so the result list groups cleanly. The names map to real FindingCategoryenum cases in the scanner.
- OWASP API Top 10 (2023)— API1 BOLA / IDOR (numeric or UUID IDs in path with no Authorization), API2 Broken Authentication (Basic over HTTP, API key in query string, write requests with no auth header), API3 BOPLA (sensitive fields like
password_hash,private_key,is_adminin responses), API4 Unrestricted Resource Consumption (no rate-limit headers on API-shaped paths), API5 BFLA (admin/internal paths exposed), and the rest of the list. - OWASP Mobile Top 10 (2024)— M1–M10 checks mapped to traffic-observable signals (insecure transport, weak cookie flags, sensitive data in logs, etc.).
- Security headers— HSTS, X-Content-Type-Options, X-Frame-Options, Content-Security-Policy, Referrer-Policy, Permissions-Policy. Missing, weak, and unsafe-inline variants each get their own finding.
- CORS — wildcard
Access-Control-Allow-Origin: *(warning) escalates to critical when paired withAccess-Control-Allow-Credentials: true, which allows cross-origin credential theft. - Cookies — per cookie: missing
HttpOnly, missingSecureon TLS, missingSameSite, and overlong expiry (more than a year). - Information disclosure— server version in the
Serverheader,X-Powered-By, exposed debug headers (X-Debug,X-Debug-Token, etc.). These are info-level by default because they don’t break anything on their own, but they hand future attackers a road map.
Run a scan in 2 steps
Click any captured request and open the Security sub-tab
Audit across the whole session in the Scan tab
+ menu. It iterates every captured request, deduplicates findings, and shows you a single ranked list across the whole proxy log. Click any finding to jump straight back to the originating request in the proxy tab.It runs in the background
Task.detached(priority: .userInitiated)so the main thread never blocks. You can keep navigating the proxy list, switching tabs, and inspecting other requests while the scan finishes — if a result is mid-flight when you select a different row, the new request’s scan supersedes it.Five findings that actually move the needle
Here’s what some of the highest-signal findings look like in practice, copied close to the literal wording the scanner produces.
API key in query string (warning · API2:2023)
Triggered by any sensitive parameter in the URL — api_key, apikey, access_token, token, secret, auth. The fix is the same every time: move it into a request header. Query strings end up in server logs, CDN access logs, browser history, and Referer headers on outbound links.
HTTP Basic Auth over plaintext (critical · API2:2023)
Fires when the request is not SSL and the Authorization header is Basic .... Base64 is not encryption. Anyone on path reads the credentials by base64-decoding a header value.
CORS wildcard with credentials (critical · API8:2023)
Fires when the response carries Access-Control-Allow-Origin: * and Access-Control-Allow-Credentials: true. The browser won’t actually honor this combination, but the configuration is a red flag — somebody intended permissive credential sharing, and the next person to touch the config might successfully wire it up.
Sensitive field in response: password_hash (warning · API3:2023)
The scanner regex-scans the response body for known-bad JSON keys:password, password_hash, private_key, credit_card, ssn, internal_id, is_admin, and friends. One match raises an API3 finding. Object Property Level Authorization is the answer — return the minimum set of fields the caller actually needs.
Cookie missing HttpOnly (warning · M9)
Any Set-Cookie response without an HttpOnly flag. XSS-stealable session cookies are the gift that keeps on giving. Same scan reports missing Secure on TLS and missing SameSite as separate findings, so a single broken cookie can light up three rows.
Why passive scanning is worth doing
- You can scan production traffic. A passive scan never replays. There is nothing to authorize, nothing to wake up at three in the morning. You can run it against the requests your own app is making right now, including against APIs you do not own.
- You can scan third-party APIs.Half the bugs in a modern app sit in code you didn’t write — the analytics SDK, the payments provider, the auth vendor. Passive scanning surfaces problems in their responses without you having to ask for a pentest engagement they’ll never grant.
- You can scan flows you don’t fully understand.Replay testing requires you to know what a request does. Passive scanning works on captured traffic of any flow, including background SDK calls you didn’t even realize the app was making.
- No WAF noise, no compliance risk. Read-only by construction. Internal audit teams love it.
Click the reference, land on OWASP
Every finding ships with a structured reference field. If the check maps to an OWASP entry (API1:2023, M5), the UI renders a clickable badge that opens the relevant OWASP page in a browser. If the finding maps to a CVE, the link goes to NVD’s detail page. The point is to make the “okay, what do I do about this” jump zero clicks: read the finding, click the OWASP ref, read the canonical explanation, fix.
What it doesn’t do
The full result, one screenful
Every Security sub-tab puts the same shape on screen: a score card at the top with the numeric score, the letter grade, and a one-line summary; then category sections that auto-expand if they hold any non-pass findings; each finding row shows its severity dot, title, detail text, and reference badge. The sub-tab updates live when you click a different request. The whole thing reads top-to-bottom in under thirty seconds for a typical endpoint, which is the goal. Security tooling that takes longer than thirty seconds is security tooling that gets skipped.
Keep reading