How to inspect HTTPS traffic on macOS in 2026 (a step-by-step guide)
A complete guide to capturing, decoding, and reading HTTPS requests on macOS — including how the certificate trust step works, what to look for in headers and bodies, and how to do it safely.

Sooner or later, every developer hits the same wall. Your app sends a request, the server sends something back, and the screen does the wrong thing. You add a log. The log says what you already knew. So you sit there wondering what actually went over the wire — and that is the moment you need to know how to inspect HTTPS traffic on a Mac.
This guide walks through the full workflow on macOS in 2026: why HTTPS is opaque by default, what a man-in-the-middle proxy does to fix that, and the exact steps to capture, decode, and read every request your machine is making. We’ll use Traceptor — a native Mac HTTP/HTTPS debugger — for the screenshots and shortcuts, but the concepts apply to any proxy you pick.
Why HTTPS is hard to inspect
HTTP is plain text. Twenty years ago you could point tcpdumpat an interface and read the requests as they flew by. HTTPS killed that party on purpose. TLS wraps the entire HTTP exchange in an encrypted tunnel that’s negotiated end-to-end between your app and the remote server. To anyone in the middle — a network sniffer, a coffee-shop router, your own MacBook’s packet capture — the payload looks like noise.
That’s great for security and terrible for debugging. You can see the TCP handshake, you can see the SNI hostname, and you can see how many bytes moved. You cannot see the URL path, the headers, the body, the status code, or the response. None of the things you actually wanted.
So how do you monitor HTTPS traffic on macOS without disabling TLS in your app? You become the middle.
The MITM proxy approach
A man-in-the-middle (MITM) proxy is a program that sits between your app and the internet and terminates TLS on both sides. Your app opens an HTTPS connection — but instead of going straight to api.example.com, it goes to the proxy. The proxy presents a certificate it generated on the fly for that hostname, your app validates it, and a normal TLS session begins. On the other side, the proxy opens its own TLS session to the real server. In the middle, the proxy can read and modify everything.
This only works if your machine truststhe certificates the proxy generates. That’s the entire trick: you install the proxy’s root Certificate Authority into your macOS keychain and mark it as trusted for SSL. From then on, certs signed by that root are valid for any hostname, but only on your machine. Anyone else who tries the same trick on your network will be rejected, because they don’t have your root in their keychain.
The mental model in one sentence
Step-by-step: inspect HTTPS on macOS with Traceptor
Let’s capture HTTPS on a Mac from scratch. The whole setup takes less than five minutes. If you’re using a different tool the names will change but the steps won’t.
Install Traceptor and trust the root CA
Download the app, drag it to /Applications, and launch it. On first run Traceptor offers to install its root certificate into your login keychain. Click Install & Trustand enter your password. macOS will prompt you a second time to confirm the trust setting — that’s the one that actually lets the cert sign for arbitrary hostnames.
Behind the scenes you’ve added one entry to Keychain Access → System with the name Traceptor Root CA. You can revoke trust at any time by deleting it, and the rest of this guide assumes you eventually will.
If you’re on a managed work laptop and the trust step is blocked, that’s your IT policy at work. Ask before fighting it.
Start the proxy and pick which apps to capture
Click the record button. Traceptor flips macOS’s system HTTP and HTTPS proxy settings to point at 127.0.0.1:9090 and starts listening. Any process that respects the system proxy — Safari, Chrome, most CLI tools that honor http_proxy, almost anything built on URLSession — will start flowing into the timeline.
One macOS gotcha worth knowing: proxy settings are per-network-service. If you start capturing on Wi-Fi and then plug in an Ethernet adapter, the new interface has its own proxy config and won’t be routed through Traceptor until you flip it too. The app handles this automatically for the active service, but if traffic suddenly goes quiet, that’s usually why.
Some apps ignore the system proxy on purpose — Go binaries that don’t read HTTP_PROXY, Electron apps with hardcoded settings, anything using pinned certificates. We’ll come back to those.
Open the app you want to debug — read headers, query, body, response
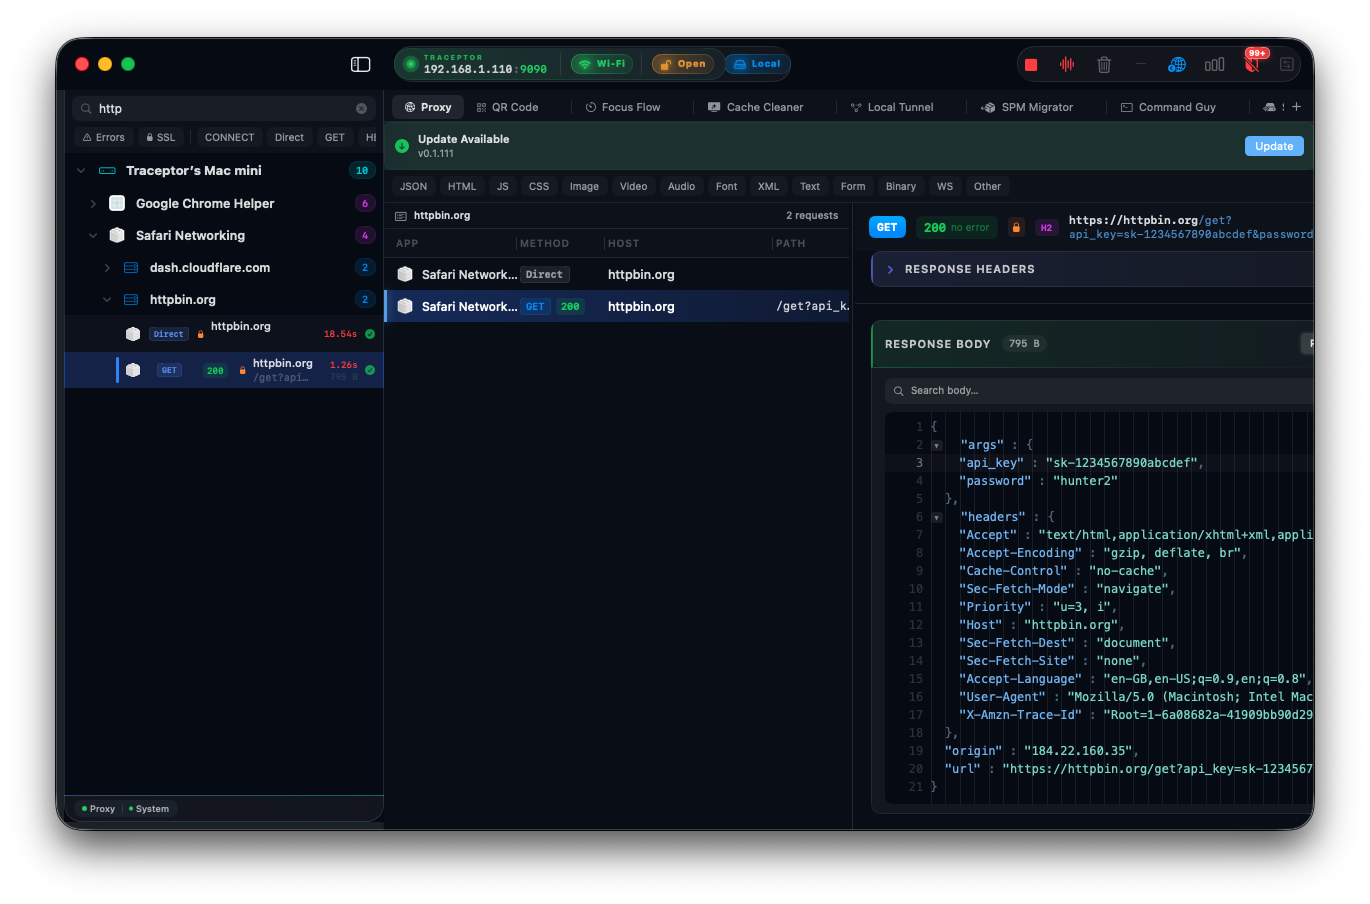
Now do the thing. Reload the page, tap the button, run the script. Requests appear in Traceptor’s timeline in real time, color-coded by status and grouped by host. Click any row to open the inspector.
The inspector splits into request and response. On each side you get:
- Headers — every header sent and received, pretty-printed. Look for
Authorization,Cookie,Cache-Control, and any customX-header your backend actually reads. - Query and body — JSON, form-encoded, multipart, GraphQL, gRPC, and protobuf are all decoded into a readable tree. You can switch to raw bytes when you need to.
- Timing — DNS, connect, TLS handshake, time to first byte, total. If something feels slow, this is where you find out which slice is to blame.
- Cookies — broken out into a table, with the flags (
HttpOnly,Secure,SameSite) the inspector in DevTools usually hides three clicks deep.
Press ⌘F to search across every captured request, ⌘L to focus the filter bar, and ⌘Rto replay the selected request with whatever edits you’ve made.
Search, filter, and export
The single most underrated feature of any HTTPS debugger is the filter bar. Type status:5xx to see only server errors. host:api.stripe.com to narrow to one vendor. body:"user_id" to find every call that mentions a field. Combine them with spaces.
When you find the request that proves the bug, right-click and choose Export → HAR or Copy as cURL. The HAR lands in any other tool. The cURL is what you paste into the bug report, so the backend engineer can reproduce the exact call in two seconds.
What you’ll actually find
The first time you watch your own app from the outside is humbling. Even small codebases turn out to be doing surprising things. A short, non-exhaustive list of what teams notice in their first session:
- Stale endpoints. Calls to a v1 URL that the backend team deprecated eight months ago, still answered by a sad little compatibility shim.
- Retry storms. A failing request that fires four times in 900 ms because three layers of the stack — the SDK, your wrapper, and the screen that mounted it twice — all believed they owned the retry policy.
- Oversized payloads. A 600 KB JSON response for a screen that shows six fields. Usually the API returns the entire object graph and the client throws 99% of it away.
- Missing headers. An auth token sent to one host but not the next one in the redirect chain. A
Cache-Controlheader you assumed the CDN was setting and it absolutely is not. - Unencrypted analytics. A third-party SDK quietly posting device IDs over plain HTTP. This one is especially common in older free SDKs.
None of this is exotic. It’s the kind of thing that’s been in your app for months and that nobody noticed because nobody looked. Looking is the whole point.
Safety: keep it sane
Trusting a custom root CA is a real privilege escalation for the tool that owns it. Treat it that way.
Rules of the road
- Don’t leave the cert trusted forever on a machine you also use for banking, email, or shared work resources. Disable trust when you’re done debugging — it’s one click in Keychain Access, or the proxy itself can do it for you on quit.
- Never share your generated root CA or private key with anyone. It is personal to your machine. Every install generates a new one.
- Only capture traffic from networks and devices you own or have written permission to test. Capturing other people’s traffic on a network you don’t control is illegal in most jurisdictions and is also just bad manners.
- Many apps use certificate pinning — they refuse to talk through a proxy on purpose. That’s working as intended. Don’t try to bypass pinning on apps you don’t own.
Beyond inspection — rewrite responses too
Once you can read HTTPS, the next move is changing it. The two most useful primitives in any proxy are Map Local(point a URL at a file on disk — available under Tools ▸ Map Local or by right-clicking any captured request and choosing Mock Response) and Scripting (run JavaScript on every matching flow, under Tools ▸ Scripting). A Traceptor script looks like this:
js// Inject a Pro entitlement into the /me response, so the
// upgrade screen renders without touching the backend.
async function onResponse(context) {
  const { request, response } = context;
  if (!request.url.endsWith("/v1/me")) return context;

  const body = JSON.parse(response.body);
  body.plan = "pro";
  body.trial_ends_at = null;
  response.body = JSON.stringify(body);
  return context;
}
Five lines, no backend changes, no feature flag, no deploy. Same trick works for empty states, error states, paid-tier UI, and the once-every-three-months bug that QA can reproduce and you cannot. Inspection tells you what’s happening; rewrite lets you ask what if.
Wrapping up
Inspecting HTTPS traffic on macOS used to be a half-day yak shave. In 2026 it’s a five-minute setup and a permanent superpower. Install a proxy, trust the root on your own machine, point your apps at it, and the network stops being a black box.
Free download. Premium one-time at $29.99, with one year of updates included (50% off this week with code WELCOME). If the first session pays for itself — and it usually does — you’ll wonder how you debugged anything before.
Keep reading